12/10/2025 Release: Quality Alerts, Mix design, Hardened Properties, etc.
QC Test: QC Alerts Users can now create and configure fully customizable alert rules to identify when test data (air, slump, strength) falls outside desired tolerances, filter to apply to target mixes, projects, materials, etc., and specify recipients. Quadrel can automatically notify users via email whenever an alert condition is triggered.
Mix Hub: Maturity and Strength Graph Users can now generate a combined maturity and strength graph for mixes with available break data. The graph and accompanying data grid allow users to compare predicted versus measured strength up to 90 days; includes ability to predict strength beyond oldest break age. Uses ASTM C1074 Arrhenius model.
Dashboard: Lazy Loading Users will notice the dashboard now loads tiles faster by prioritizing the data displayed first on the QC tab. Additional dashboard data is loaded in the background, reducing overall wait time.
Mix Hub: Lazy Loading Users will notice the Mix Hub now loads faster by prioritizing loading data displayed on visible tabs.
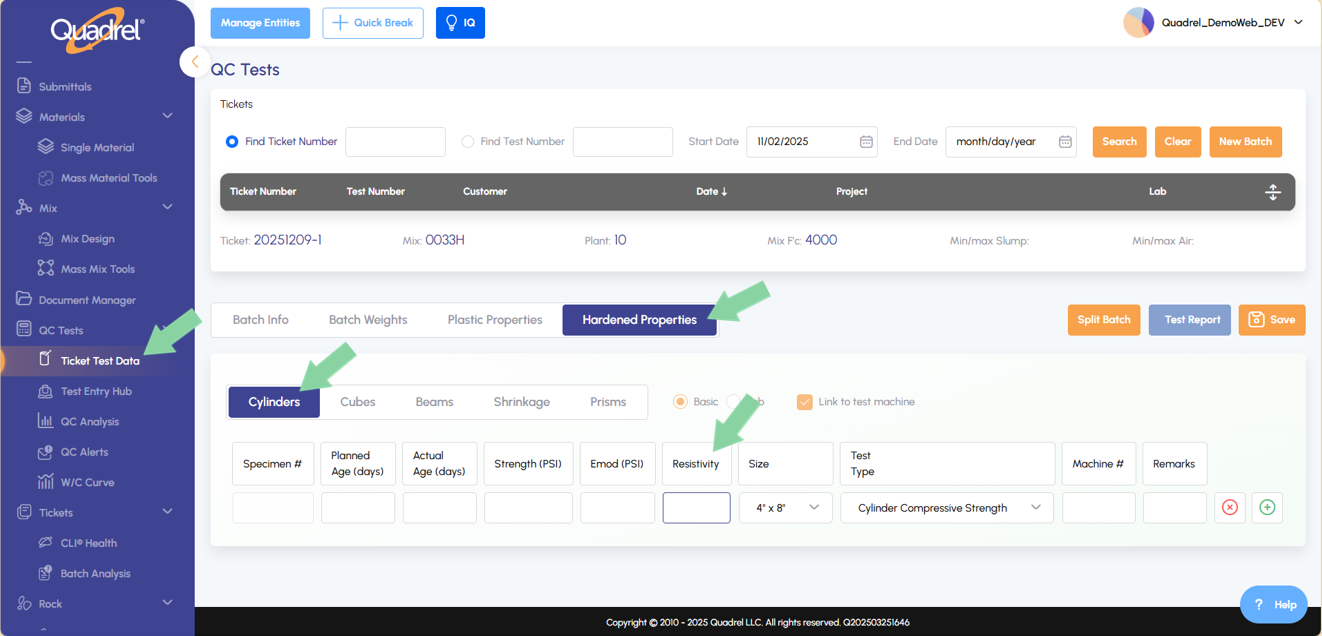
Hardened Properties Cylinders: Resistivity In both Basic and Lab modes, users can now record resistivity data for cylinders within the hardened properties section of a ticket.
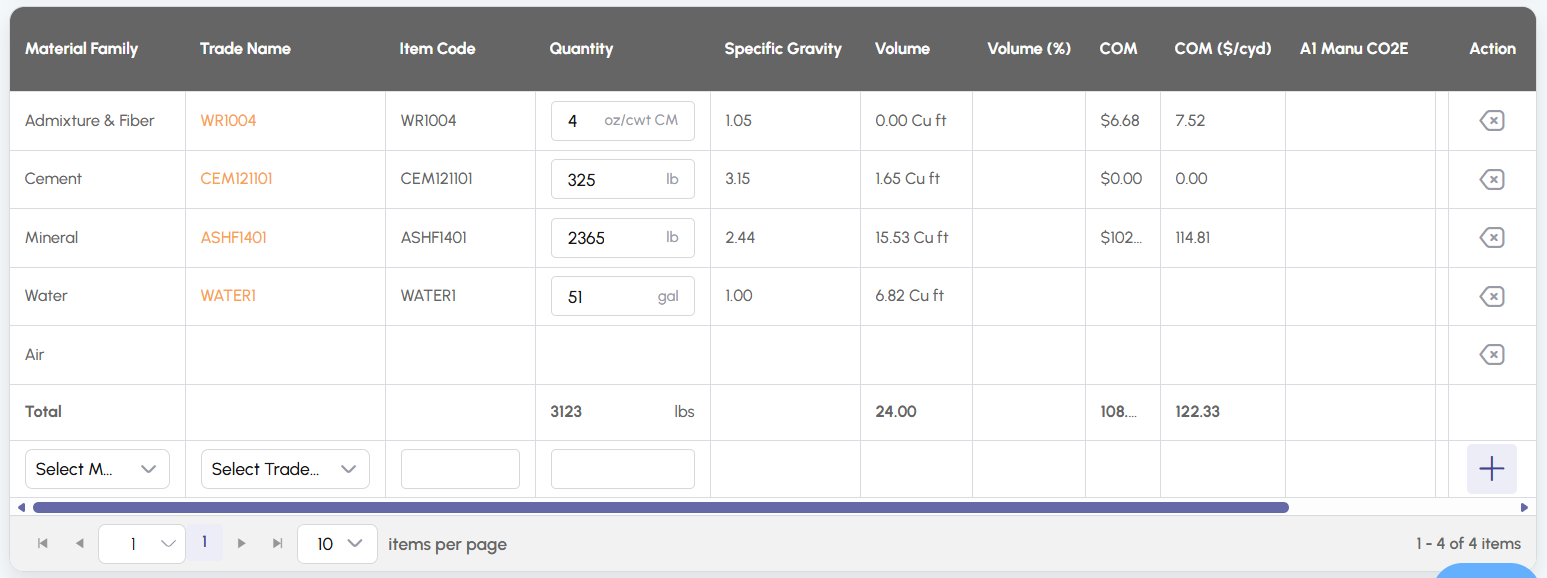
Grid Improvements: Dynamic Containers Grid containers throughout Web Quadrel now automatically adjust their size based on the content they display, improving readability and layout consistency.
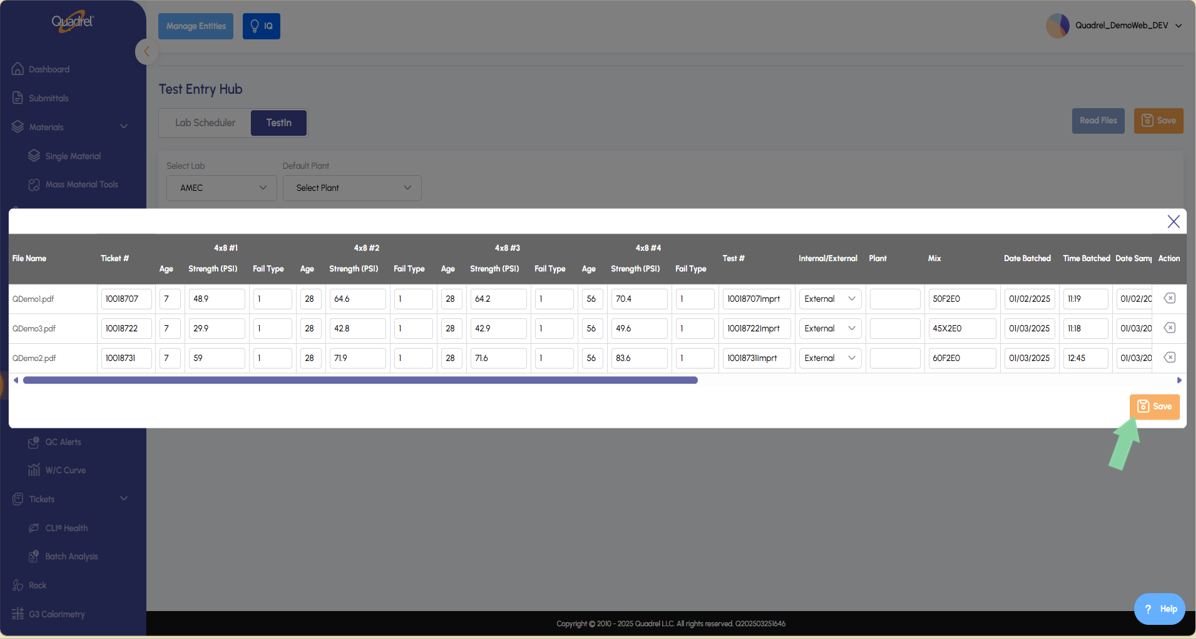
AI TestIn: Save from Pop Out Users can now save test files directly from the maximized popped-out view, improving workflow convenience and reducing navigation steps.
AI TestIn: Email Forward lab report pdfs to a designated Quadrel email and AI TestIn will auto-read them into your database. Note this feature requires licensing and setup.
Rock: Reports Users can now utilize the reporting page in Rock if data has been entered for selected aggregate materials.
QC Test: QC Alerts.
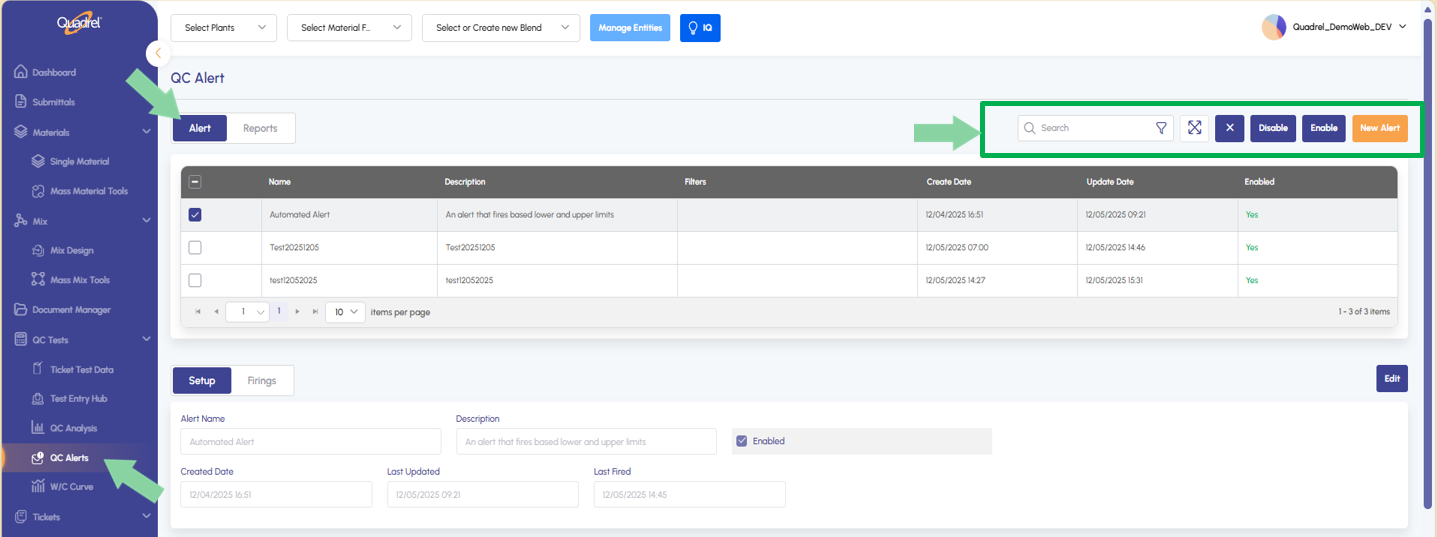
From the navigation menu on the left side of the page select the new option "QC Alerts", by default the Alert tab will open. The first grid shows existing Alerts in your account. Users can checkbox existing alerts to disable, enable, or delete. Additionally, users can create new by clicking the orange "New Alert" button.
To configure an Alert, double click the alert in the first container on the Alerts page, by default the first alert is pre-selected.
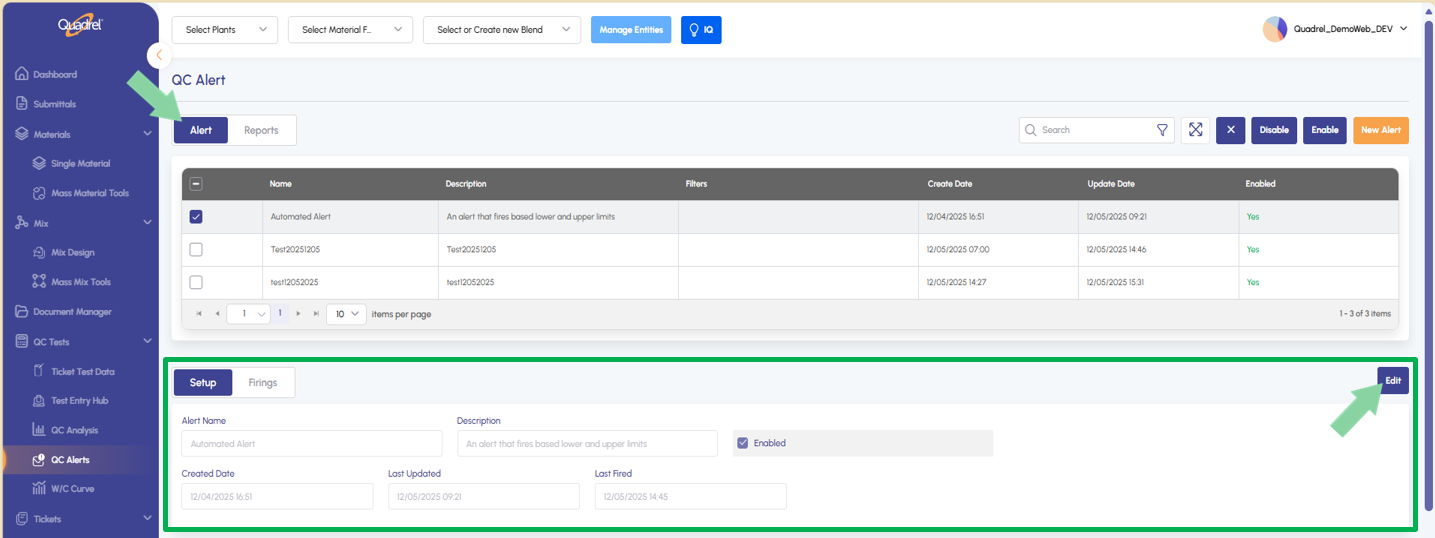
With an alert selected, you will see that alert populated in the remaining containers as you scroll down the Alert page. The second container allows users to edit alert details if needed, be sure to save after making changes.
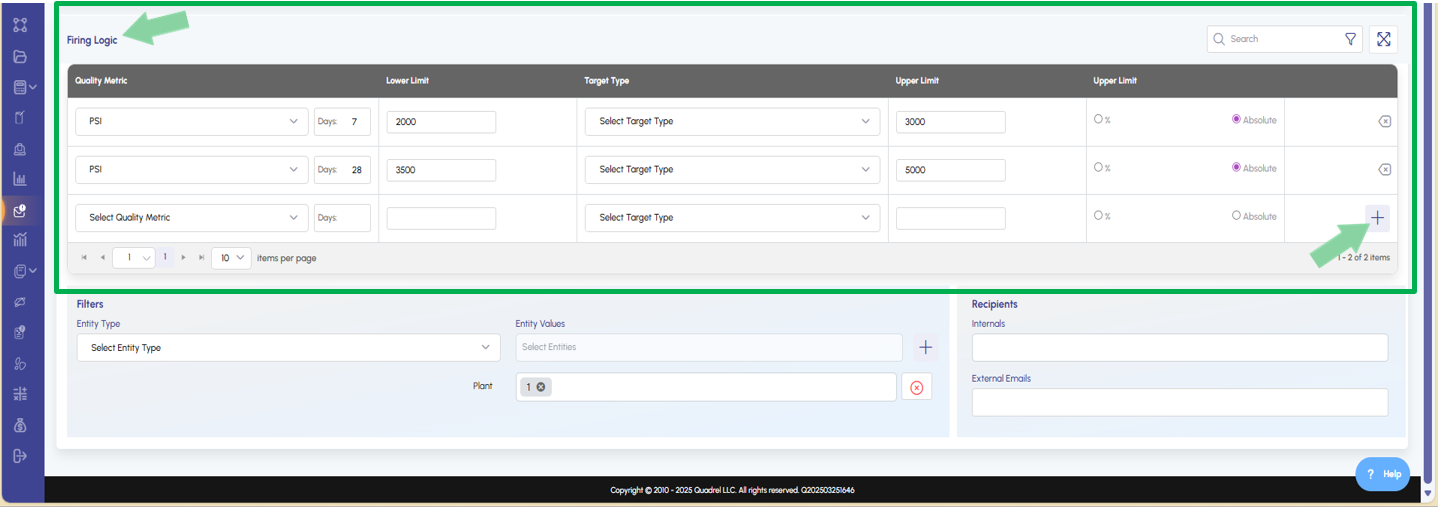
Scrolling down on the same page the next alert setup item is Firing Logic. In this table users define what conditions will trigger alerts to be sent out based on expected results and tolerances. In the example below there are two separate conditions, once you have completed filling in the information for a row, click the plus icon to apply the firing logic to this alert.
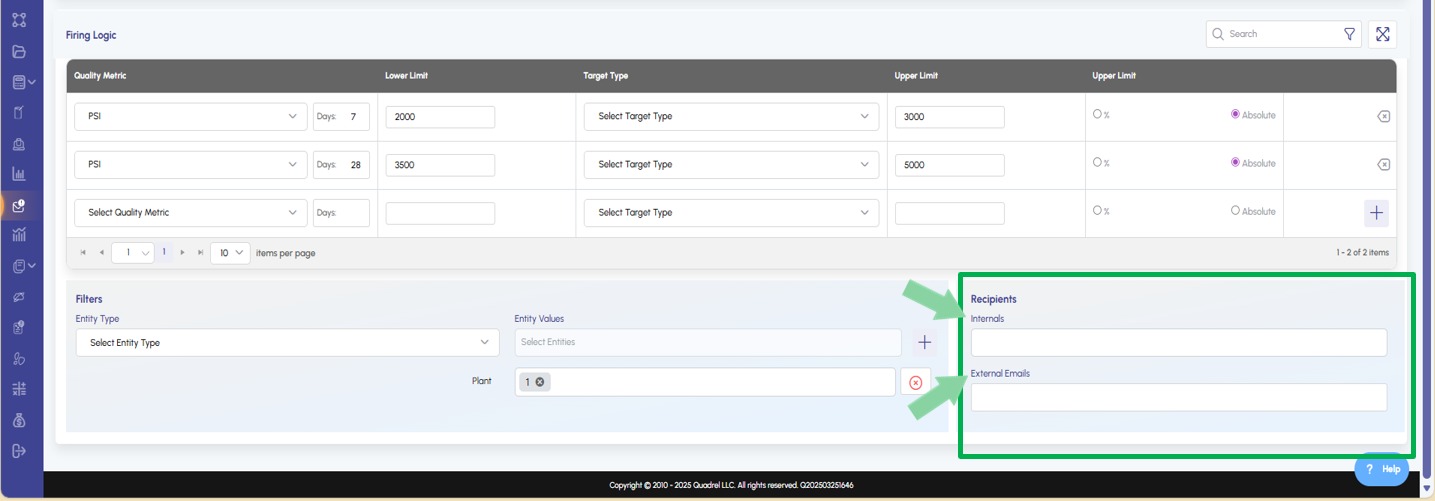
The last two sections while scrolling down this page are Filters and Recipients.
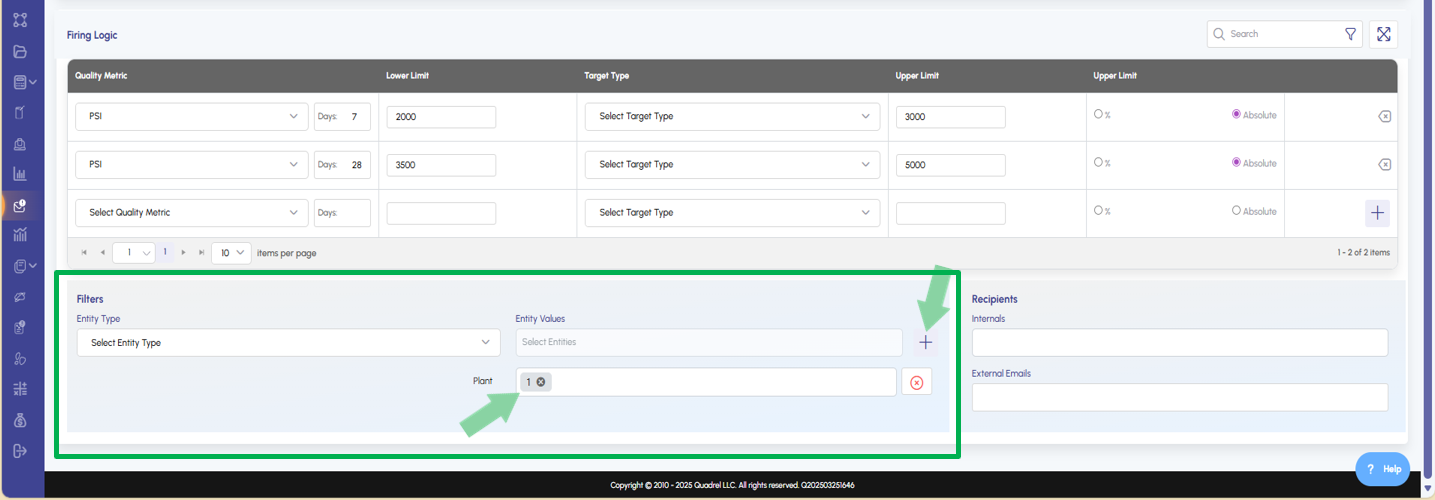
In the filters section, users can select one or multiple entity types to filter alerts by. Select the desired entity type as well as value, then click the plus icon to add the filter to the alert. Be sure to click save once done making changes.
In the example below, we have added a plant 1 filter to the alert. This means only the firing logic that has its conditions met in plant 1 will produce an alert for the user.
In the recipient's section, users can select one or multiple existing internal recipients. Additionally, users can enter external email addresses to receive alerts as well.
Mix Hub: Add Materials to a Mix without an Item Code.
Materials created in legacy Quadrel were not required to have an item code. In the web version of Quadrel the software requires a material item code upon material creation. For backwards compatibility of using older materials from legacy Quadrel in web Quadrel, mix designs in the web can now add materials without item codes.
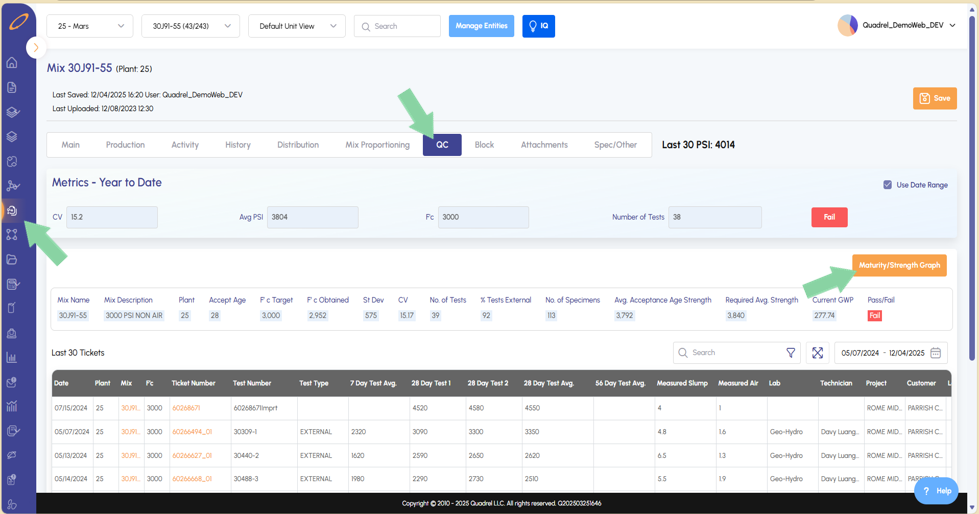
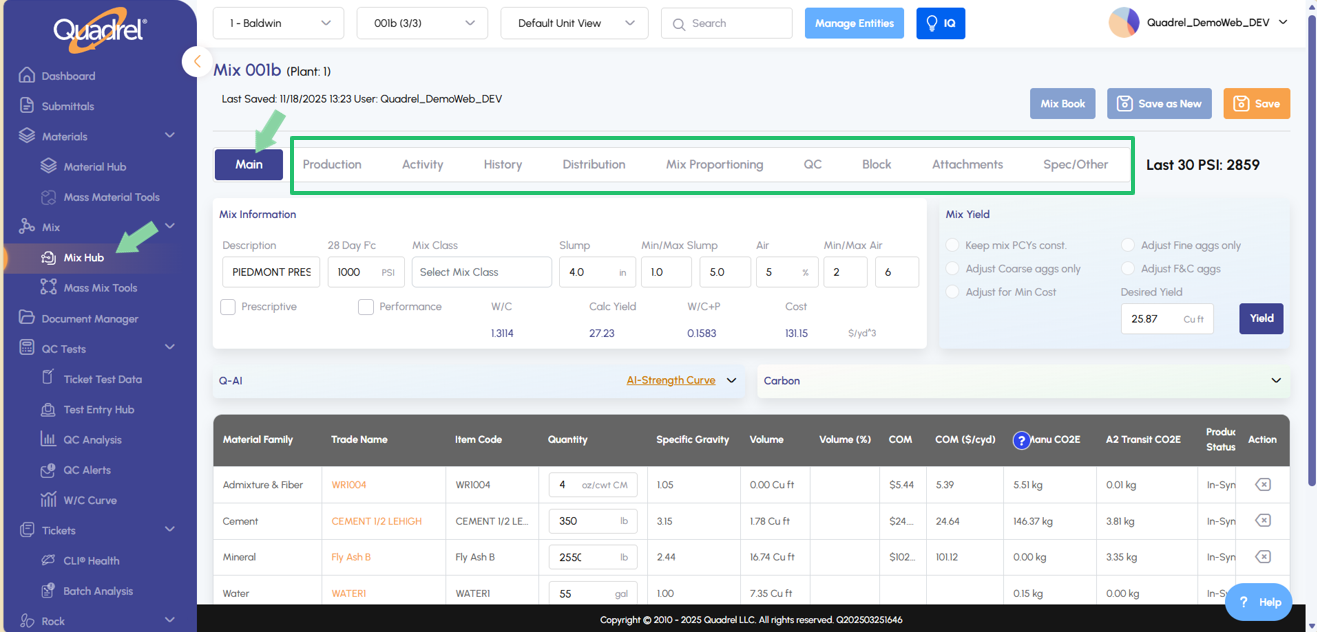
Mix Hub: Maturity and Strength Graph.
In Mix Hub, users can select a mix that has break data and then navigate to the QC tab. Users will notice a new button labeled Maturity/Strength Graph as shown in the screenshot below.
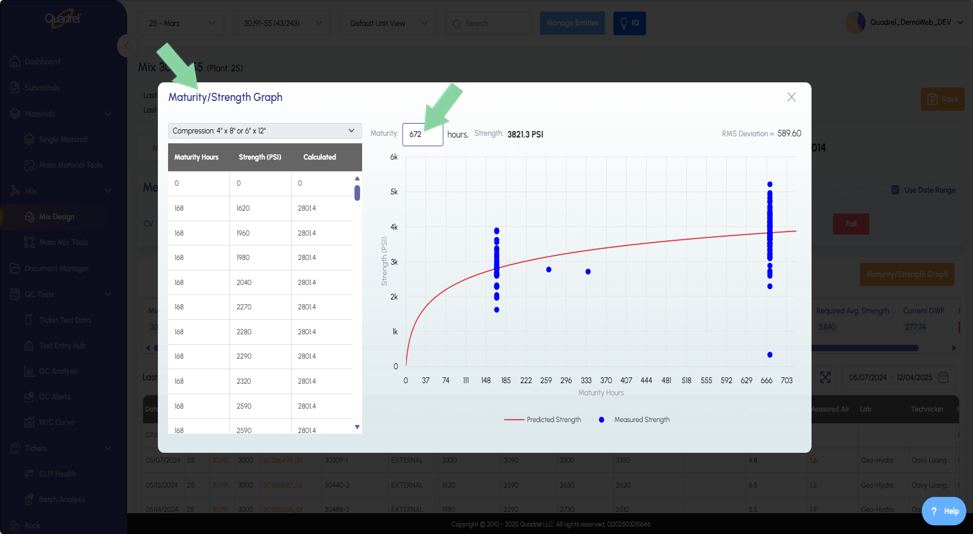
Clicking the button will open up the Maturity/Strength Graph and generate a graph if enough break data is attached to the mix.
Users can scroll through calculated data at specific maturity hours.
Users can enter a specific amount of maturity hours and Quadrel will return the Strength in PSI at the entered hours.
A graph is generated for the user to visualize Quadrel's predicted strength versus measured strength results.
The RMS Deviation is displayed to the user at the upper right of the Maturity/Strength Graph.
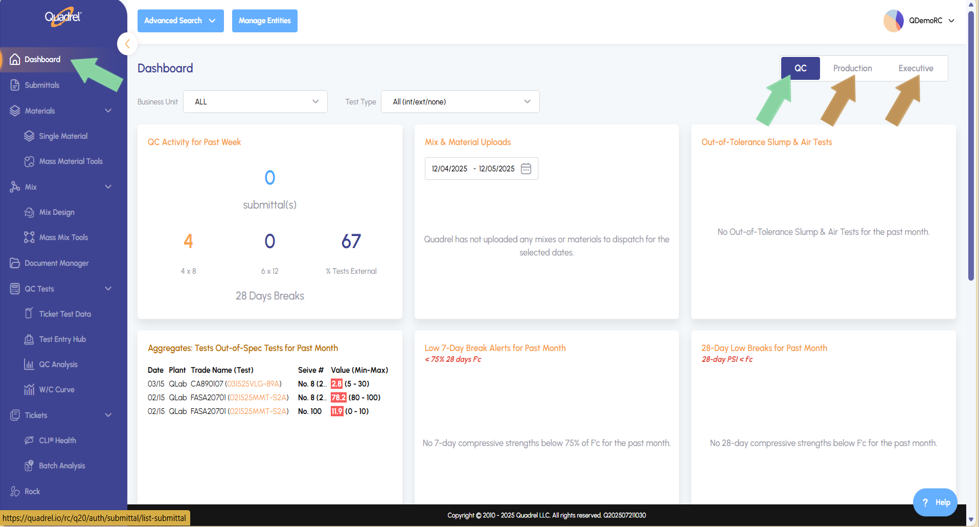
Dashboard: Lazy Loading.
Loading tiles on the dashboard page is now faster due to the implementation of lazy loading. These changes make the software load data on the default tab first, while other tabs on the page load data in the background.
Mix Hub: Lazy Loading.
Loading mixes in the mix hub is now faster due to the implementation of lazy loading. These changes make the software load data on the default tab first, while other tabs on the page load in the background.
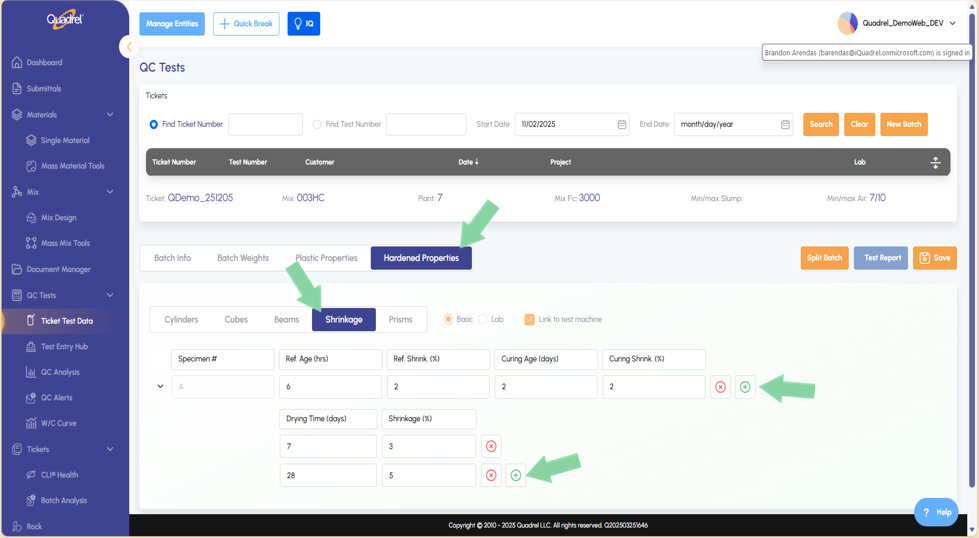
Hardened Properties: Shrinkage.
Users can now enter shrinkage data in a tickets hardened properties. From the hardened properties tab, switch to Shrinkage and use the green plus icon to add additional rows as needed.
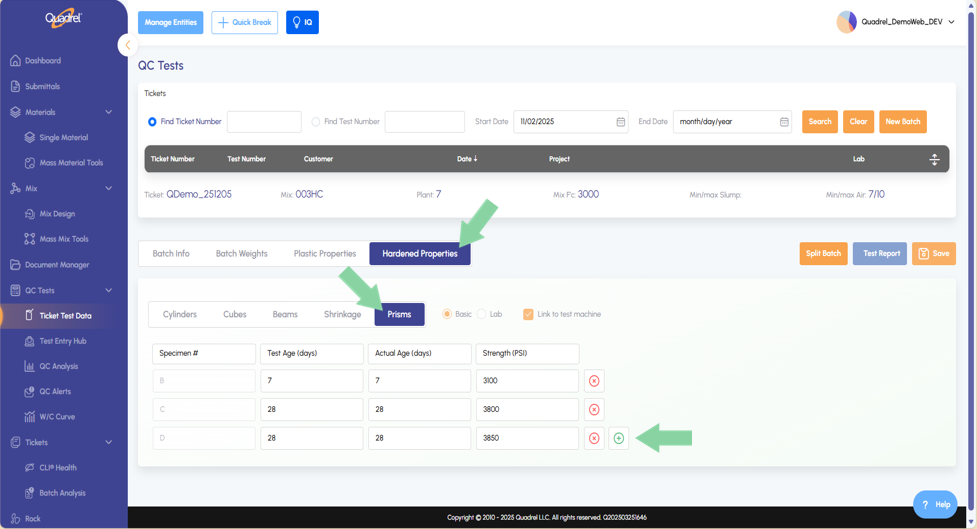
Hardened Properties: Prisms.
Users can now enter prism data in tickets hardened properties. From the hardened properties tab, switch to Prisms and use the green plus icon to add additional rows as needed.
Hardened Properties Cylinders: Resistivity.
Users can now enter Resistivity datafor cylinders in a tickets hardened properties. From the hardened properties tab, switch to Cylinders and note the new column. Resistivity is available in both basic and lab views.
Grid Improvements: Dynamic Containers.
Users will find grids in web Quadrel are now dynamic to the amount of content displayed in the grid.
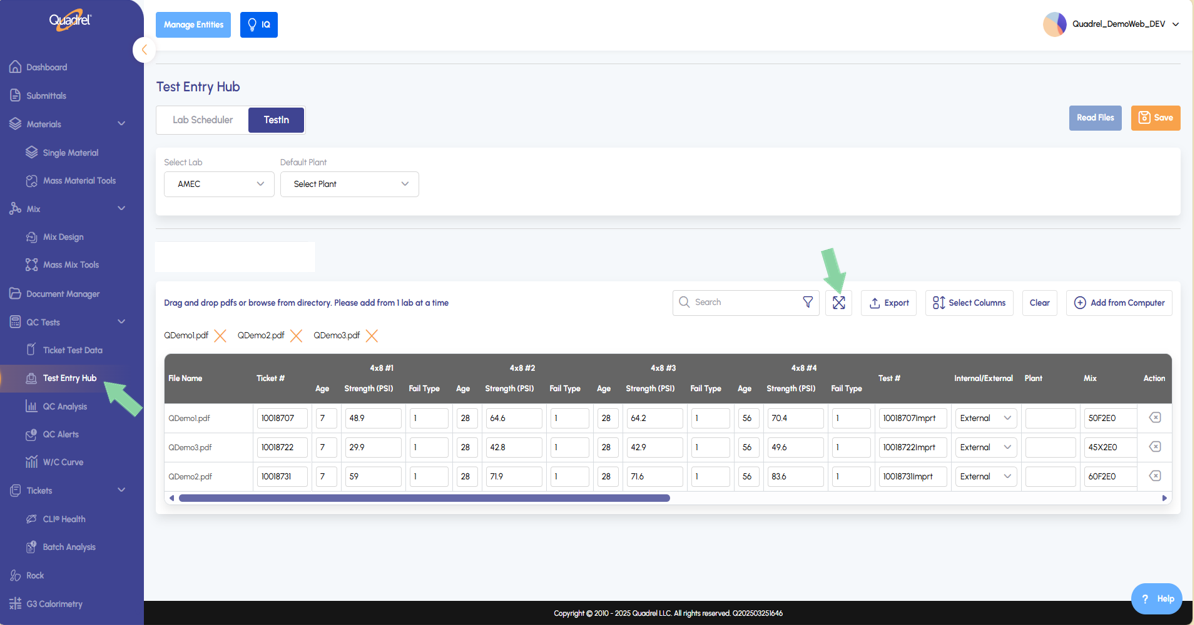
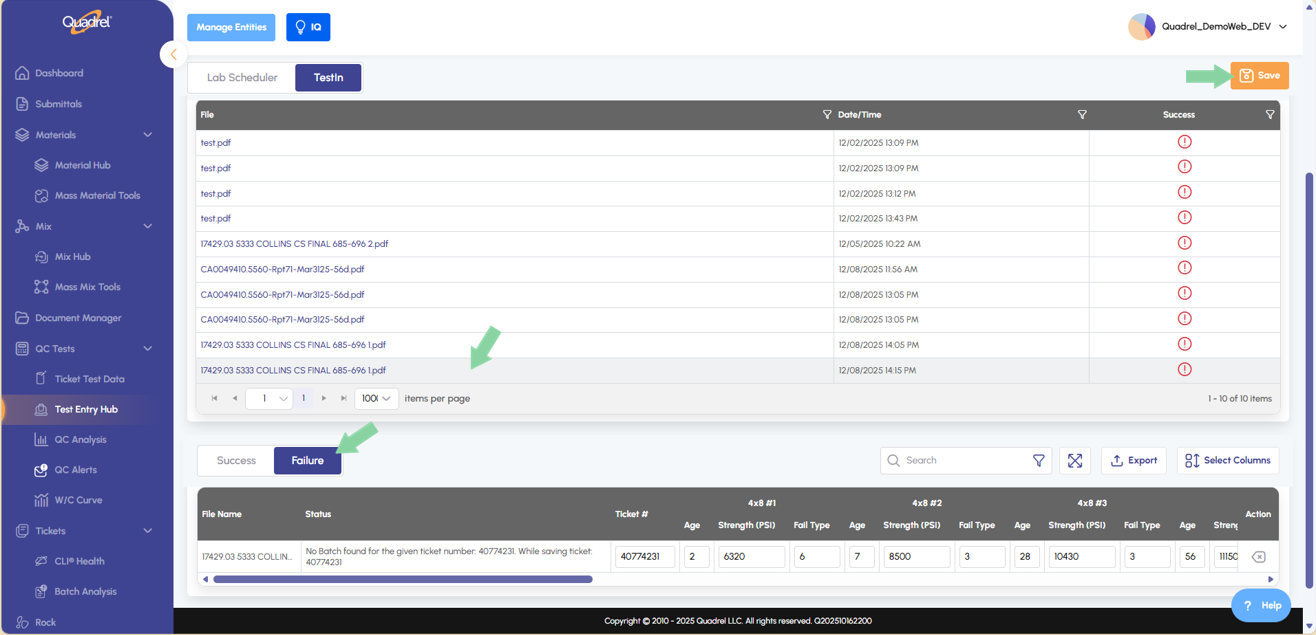
AI TestIn: Save from Pop Out.
After reading in test data users have the option to pop out the grid to a larger view. Click the icon shown in the image below to pop out the grid.
Users will now see they have the ability to save test datadirectly within the popped-out grid.
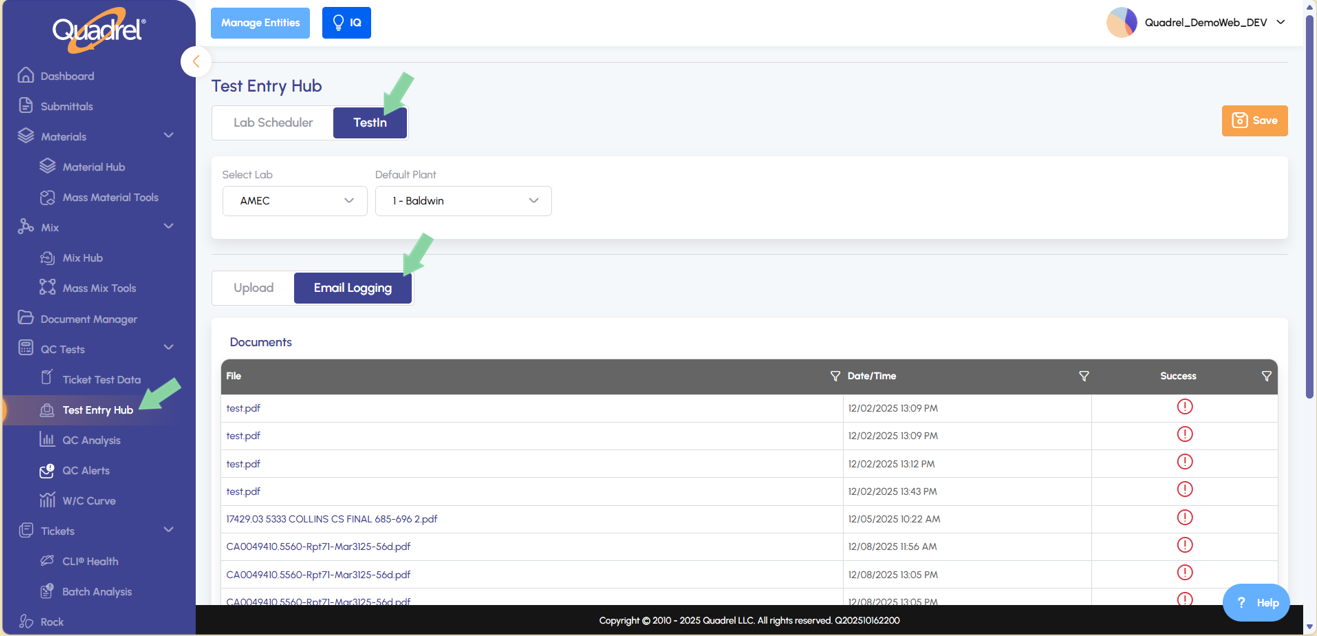
AI TestIn: Email.
Users with access to AI TestIn can now forward test data from their labs directly to Quadrel and have the ticket test data extracted and imported automatically.
Test Data files will arrive to the document's container on the Email Logging tab. Test data files that failed to be read in will have a red icon in the Success column. Users can click on failed rows to open that ticket down below and fix what is causing failure. Be sure to save after making changes on failed rows to attempt reimporting the ticket successfully.
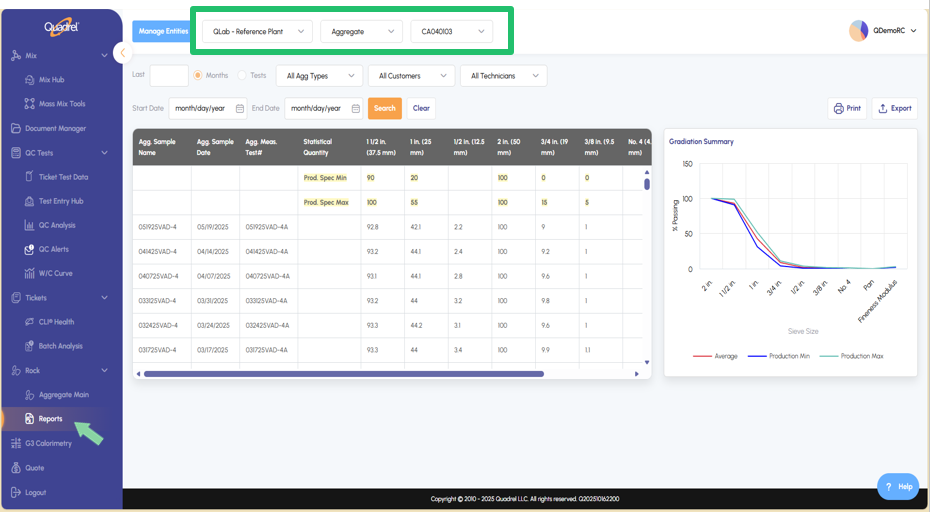
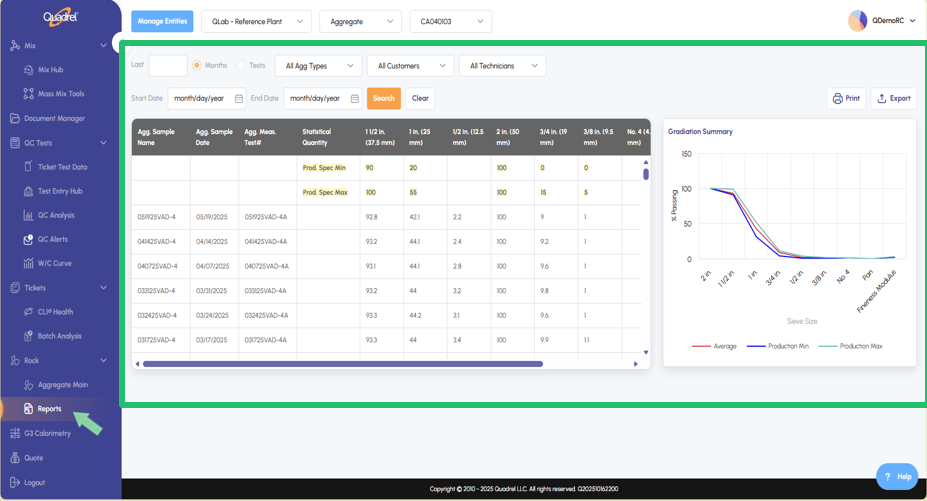
Rock: Reports.
Users can now utilize the reporting page in Rock if data has been entered for selected aggregate materials.
Select the desired plant, material type, and material.
If data is entered for your aggregate reports, in the grid users will see minimum and maximum limits, upper and lower for sieve test. Users can scroll down the grid to see average, standard deviation, minimum & maximum, and the number out of spec. Users can also utilize the filters in addition to other features such as Print & Export.